Do You Really Understand Your Lead Gen Sales Activity Funnel?
October 1, 2012
Do you really understand the how and the why behind what your outbound lead generation team should be doing on daily, weekly, monthly, quarterly, and annual basis?
Hopefully, the answer is yes, but all too often managers just start driving towards the goal without truly understanding what is going on. At the heart of this question lies what I call the lead gen sales activity funnel, and understanding this funnel and the associated conversion rates is the key not only to setting the right expectations within your organization, but to driving process improvement, as well.
My colleagues and I here at OpenView blog frequently about the importance of monitoring conversion rates throughout the lead generation process. This post from Devon McDonald, “Is Your Sales Team Really Looking at Conversion Rates?” is a great example. I have also written a number of posts on tactics that may help you improve those lead gen conversion rates, such as email prospecting best practices and getting past the gate keeper, but seeing the big picture helps put those things in context.
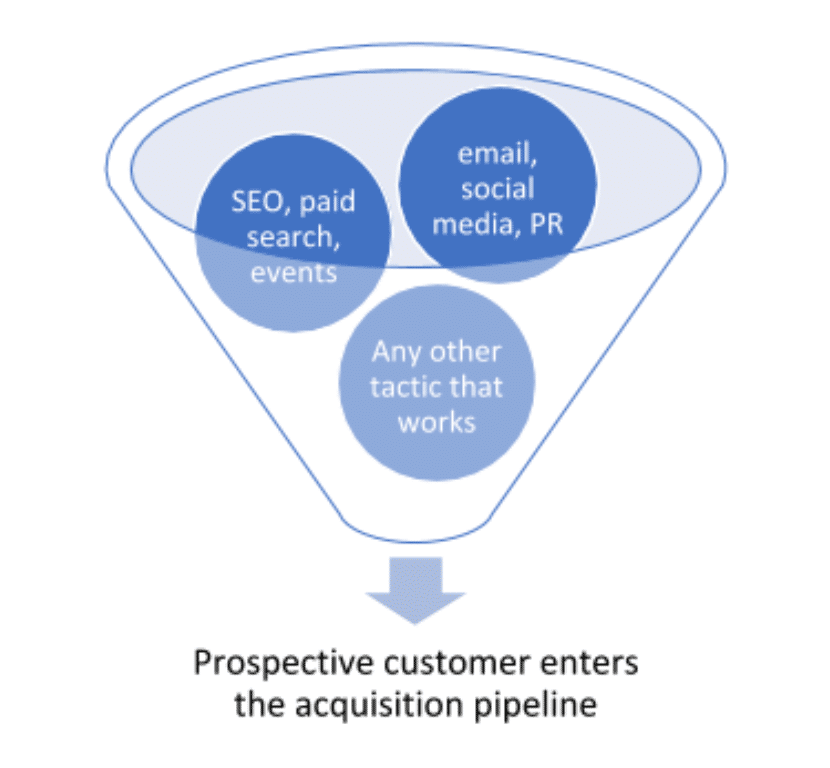
It should all start with a specific organizational goal that the outbound lead generation team should focus on.
For example, your goal might be to generate 50% of the new business pipeline for next year. The plan for next year is $10 million in new business bookings, and you need to carry a 4X pipeline because you know that your opportunity win rates historically are roughly 25%. That means the new team will have to generate $20 million in pipeline for next year. Once you have your starting point you can work backwards to get to the goals for the rest of your outbound lead generation metrics.
In other words, based on your average deal size and average conversion rates, how many calls, conversations, appointments, and opportunities does your team need to generate on an annual, quarterly, monthly, weekly, and daily basis in order to get to that $20 million in pipeline?
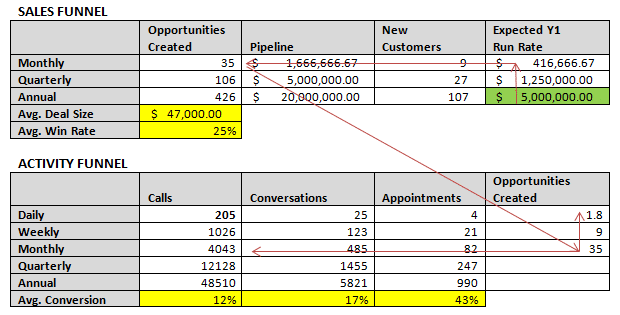
This table works backwards from the ultimate goal of generating $5 Million dollars based on the conversion rates and average deal size in the yellow boxes. In this example the average deal size is $47,000 and the average opportunity win rate 25% (this reflects the 4x pipeline target). You will need to understand this model in order to have realistic expectations of what can be done, and you can use it to figure out how many reps you’ll need to hire and what their goals should be. This model indicates that your lead generation team would have to be able to make 205 calls per day in order to generate 82 appointments per month, which should turn into 35 opportunities. Studies show that, on average, outbound lead generation reps make about 50 calls per day, which means that you would need about four reps on your lead gen team to get to that goal. It also means that each rep can generate about $5 million in pipeline per year, which should result in $1.25 million in revenue if the model holds. Not bad considering the average fully loaded cost of one lead generation rep is under $100k.
If you are building a new lead gen team from scratch you may not know the conversion rates that go in the yellow boxes. In that case, use both qualitative and quantitative data from your current sales team to get some sense of what a realistic conversion rate might be for each conversion point. You can also look at industry benchmarks from variety of different sources to get a sense, but keep in mind conversion rates can be drastically different depending on the market you’re calling into, the persona you’re targeting, and a plethora of other variables. As an example, the conversion metrics in the example above were the actual conversion rates for a company that I worked with in the past, which successfully implemented a lead generation team to support their field sales organization.
Regularly test the model:
At the end of each month and quarter, recalculate your average conversion rates by taking the aggregates of all of the activity, not just on a per rep basis (this will give you a more accurate representation). You should also recalculate your average opportunity win rate and average deal size. Then plug those numbers into the model to make sure that it’s holding. This will allow you to immediately see the impact that slide improvements can have on the pipeline and top line.
Another extremely important dimension that needs to be considered when building your model is timing. I’ll dive deeper into that in my next post.
Swayne Hill, SVP at Mintigo, has also published some great content on this topic at his blog.
If you’d like a copy of the spread sheet with all of the calculations feel free to shoot me an email.